

(Source: imgflip)
The right watchlist can literally make you a fortune, because it will allow you to make consistently reasonable, prudent, and most of all, profitable long-term decisions.
The Dividend Kings Master List of 478 companies, including:
- All Dividend Champions (companies with 25+ year dividend growth streaks)
- All Dividend Aristocrats (S&P companies with 25+ year dividend growth streaks)
- All Dividend Kings (companies with 50+ year dividend growth streaks)
- All 11/11 quality Super SWANs (5/5 safety + 3/3 wide-moat businesses + 3/3 excellent management quality/dividend cultures, basically as close to a perfect company as exists on Wall Street)
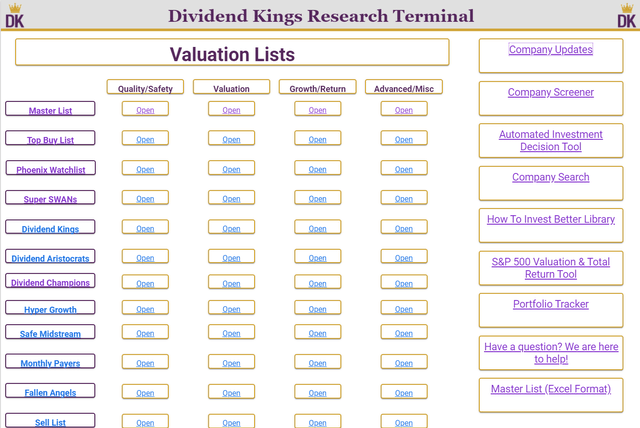
This is the core of the Dividend Kings Research Terminal, from which we create numerous valuable watchlist for our members to profit from.
Each week members submit research requests for all of the Kings to analyze companies they are interested in.
The Master List is capped at 500 companies, the most I can review on an annual basis, and update over 80 fundamentals metrics pertaining to quality, safety, growth, valuation, and long-term return potential.
But since our goal is to eventually turn the Dividend Kings Master List into the 500 best companies you can own (95+% of which will pay dividends), I’m always analyzing companies for possible inclusion for the list. Inclusion into the Phoenix Watchlist is the ultimate endorsement of quality and safety.
Dividend Kings Phoenix List: The Blue-Chips Most Likely To Rise From The Ashes Of This Recession And Soar To New Heights
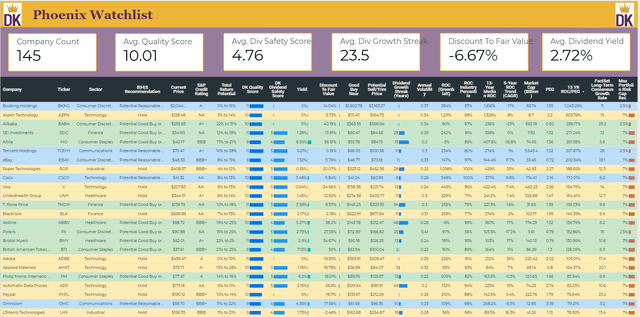
(Source: Dividend Kings Research Terminal): list sorted by highest historical return on capital/PEG ratio (BM Cashflow Detectives Super Metric)
The safety and quality of the Phoenix list are impeccable.
- 10/11 SWAN quality vs 9.7 average aristocrat
- 4.8/5 very safe dividends vs 4.5/5 very safe average aristocrat
- average dividend growth streak: 23.5 years vs 20 Ben Graham standard of excellent
- 80% returns on capital (Greenblatt proxy for quality) = 6X the S&P 500 average
- Average credit rating: A- stable outlook vs A- stable average aristocrat = 2.5% 30-year bankruptcy risk
The Phoenix list is the only watchlist that I’m willing to buy from during this recession.
Today I wanted to share with you the results of the analysis on two of the most popular growth stocks on Wall Street today, Teladoc Health (TDOC), and Booking Holdings (BKNG). Both were Dividend Kings member analysis requests, and both companies, on paper, hold incredible potential to make you rich over time.
One of these companies is among the highest-quality companies on earth. That’s not just according to the Dividend Kings safety & quality models, but Joel Greenblatt, one of the greatest investors of all time.
The other is a very speculative, below-average quality, and wildly overvalued company that I recommend only the most risk-tolerant investors own, in very modest amounts.
Booking Holdings: The Super SWAN King Of Online Travel
The Dividend King’s mantra is “quality first and prudent valuation and risk-management always.” To assess the quality of a company we look at three separate overall themes that together tell us whether a company can make long-term investors rich, or is a value trap that can send you to the poor house.
- safety (5 point rating scale)
- business model (3 point rating scale)
- long-term dependability (3 point rating scale)
- 11 point overall quality score
Dividend Kings Rating System
| Quality Score | Meaning | Max Invested Capital Risk Recommendation | Margin Of Safety Potentially Good Buy | Strong Buy | Very Strong Buy |
Ultra-Value Buy |
| 3 | Terrible, Very High Long-Term Bankruptcy Risk | 0% | NA (avoid) | NA (avoid) | NA (avoid) |
NA (avoid) |
| 4 | Very Poor | 0% | NA (avoid) | NA (avoid) | NA (avoid) |
NA (avoid) |
| 5 | Poor | 0% | NA (avoid) | NA (avoid) | NA (avoid) |
NA (avoid) |
| 6 | Below-Average, Fallen Angels (very speculative) | 1% | 35% | 45% | 55% | 65% |
| 7 | Average | 2.5% | 25% to 30% | 35% to 40% | 45% to 50% |
55% to 60% |
| 8 | Above-Average | 5% (unless speculative then 2.5%) | 20% to 25% | 30% to 35% | 40% to 45% |
50% to 55% |
| 9 | Blue-Chip | 7% (unless speculative then 2.5%) | 15% to 20% | 25% to 30% | 35% to 40% |
45% to 50% |
| 10 | SWAN (a higher caliber of Blue-Chip) | 7% (unless speculative then 2.5%) | 10% to 15% | 20% to 25% | 30% to 35% |
40% to 45% |
| 11 | Super SWAN (as close to perfect companies as exist) | 7% (unless speculative then 2.5%) | 5% to 10% | 15% to 20% | 25% to 30% |
35% to 40% |
We use a company’s overall quality and risk profile (whether it’s speculative or not for various reasons) to determine what kind of margin of safety is required to consider it a potential good, strong, very strong, or ultra-value buy.
The first step is always safety, for both dividend and non-dividend stocks.
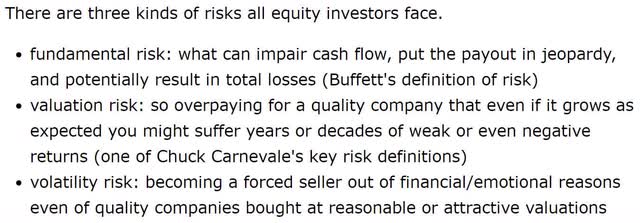
 You can’t grow your wealth over time if the companies you own go to zero. This is the definition of fundamental risk, one of three kinds of risks that all long-term successful investors pay attention to.
 To assess fundamental risk, for any company, we utilize a 38 safety metric model that uses the metrics that rating agencies, asset managers, and the world’s best research universities have concluded are most predictive of long-term bankruptcies and historical dividend cut risk in recessions.
Dividend Kings Safety Model
| 1 |
2019 Payout Ratio vs safe level for the industry (historical payout ratio vs dividend cut analysis by industry/sector |
| 2 |
2020 Consensus Payout Ratio vs safe level for the industry (historical payout ratio vs dividend cut analysis by industry/sector) |
| 3 |
2021 Consensus Payout Ratio vs safe level for the industry (historical payout ratio vs dividend cut analysis by industry/sector) |
| 4 |
2022 Consensus Payout Ratio vs safe level for the industry (historical payout ratio vs dividend cut analysis by industry/sector) |
| 5 |
2023 Consensus Payout Ratio vs safe level for the industry (historical payout ratio vs dividend cut analysis by industry/sector) |
| 6 |
Debt/EBITDA vs safe level for industry (credit rating agency standards) |
| 7 |
Historical Debt/EBITDA vs safe level for industry (credit rating agency standards) |
| 8 |
Interest coverage ratio vs safe level for industry (credit rating agency standards) |
| 9 |
Historical Interest coverage ratio vs safe level for industry (credit rating agency standards) |
| 10 |
Debt/Capital vs safe level for industry (credit rating agency standards) |
| 11 |
Current Ratio (Total Current Assets/Total Current Liabilities) |
| 12 | Historical Current Ratio |
| 13 |
Quick Ratio (Liquid Assets/current liabilities (to be paid within 12 months) |
| 14 | Historical Quick Ratio |
| 15 | S&P credit rating |
| 16 | S&P rating outlook |
| 17 | Fitch credit rating |
| 18 | Fitch rating outlook |
| 19 | Moody’s credit rating |
| 20 | Moody’s rating outlook |
| 21 | MSCI ESG Score |
| 22 | ESG Trend |
| 23 | 30-year bankruptcy risk |
| 24 |
Implied credit rating (if not rated, based on average borrowing costs, debt metrics and advanced accounting metrics) |
| 25 |
Average Interest Cost (cost of capital and verifies the credit rating) |
| 26 |
Dividend Growth Streak (vs Ben Graham 20 years of annual dividends standard of excellence) |
| 27 |
Uninterrupted Dividend Streak (vs Ben Graham 20 years of uninterrupted dividends standard of quality) |
| 28 |
Dividend Growth Streak since 2008, annual dividend growth including through Great Recession |
| 29 |
Uninterrupted Dividend Streak since 2008, no dividend cut in Great Recession |
| 30 |
Analysts Consensus Expects Steady/Rising Dividends |
| 31 |
Piotroski F-score (advanced accounting metric measuring short-term bankruptcy risk) |
| 32 |
Historical F-score vs 4+ safety guideline |
| 33 |
Altman Z-score (advanced accounting metric measuring long-term bankruptcy risk) |
| 34 |
Historical Z-score vs 1.81+ safety guideline |
| 35 |
Beneish M-score (advanced accounting metric measuring accounting fraud risk) |
| 36 |
Historical Beneish M-score vs -2.22 or less safety guideline |
| 37 |
Dividend Cut Risk In This Recession (based on blue-chip economist consensus) |
| 38 |
Dividend Cut Risk in Normal Recession (based on historical S&P dividend cuts during non-crisis downturns) |
Using historical dividend cut data, as well as the blue-chip economist consensus, the proprietary weightings we use on these metrics allows us to predict with high accuracy the probability of dividend cuts in this or any given recession.
- based on every recession from 1945 through 2009
- confirmed by the Great Recession dividend cuts
- confirmed by the pandemic dividend cuts so far
| Safety Rating | Dividend Kings Safety Score (38 Safety Metric Model) | Approximate Dividend Cut Risk (Average Recession) |
Approximate Dividend Cut Risk In This Recession |
| 1 (unsafe) | 0% to 20% | over 4% | 16+% |
| 2 (below average) | 21% to 40% | over 2% | 8% to 15% |
| 3 (average) | 41% to 60% | 2% | 4% to 8% |
| 4 (above-average) | 61% to 80% | 1% | 2% to 4% |
| 5 (very safe) | 81% to 100% | 0.5% | 1% to 2% |
Now obviously not every metric will be appropriate for every sector, industry, or company. But by looking at the safety guidelines, derived from decades of historical data correlated to bond defaults, bankruptcies, and dividend cuts, we can estimate the safety of virtually any company in the world.
S&P Leverage Safety Guidelines For Most Corporations
| Rating | Safe Debt/EBITDA for Most Companies |
| BBB | 3.0 or less |
| A | 2.5 or less |
| A+ | 1.8 or less |
| AA | 1.5 or less |
| AAA | 1.1 or less |
Here, for example, is S&P’s guidelines for most companies when it comes to what amount of leverage is safe for various credit ratings.
What about Booking Holdings?
Booking Holdings Business Summary
Booking is the world’s largest online travel agency by sales, offering booking services for hotel and vacation rooms, airline tickets, rental cars, restaurant reservations, cruises, experiences, and other vacation packages.
The company operates a number of branded travel booking sites, including Priceline.com, Booking.com, Agoda, OpenTable, and Rentalcars.com, and has expanded into travel media with the acquisitions of Kayak and Momondo. Transaction fees for online bookings account for the bulk of revenue and profits.” – Morningstar
This is the company formerly known as Priceline.com, and it’s one of the greatest money makers in the history of Wall Street.
As long as you avoided paying insane valuations, such as during the tech bubble, you’ve made a fortune owning the king of online travel.
BKNG: The Ultimate Lesson In Valuation Risk
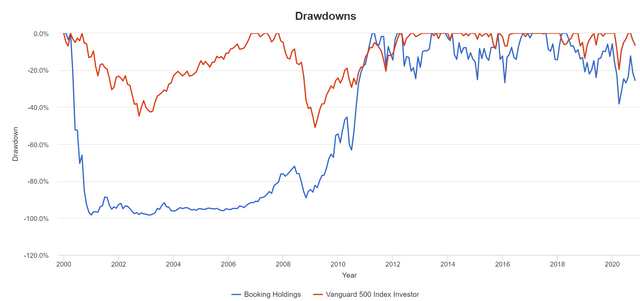
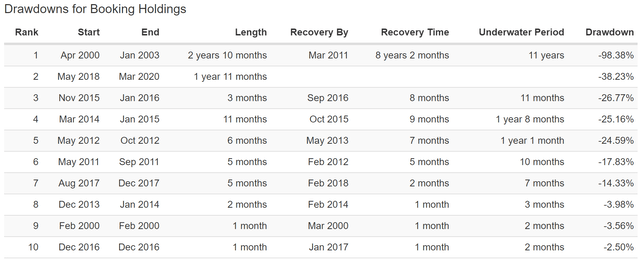
(Source: Portfolio Visualizer)
BKNG’s average 15-year rolling return, which is 91% the result of fundamental quality and growth, are exceptional, 31.7% CAGR, almost 5X that of the S&P 500 over the last 20 years.
BKNG Rolling Returns Since 2000
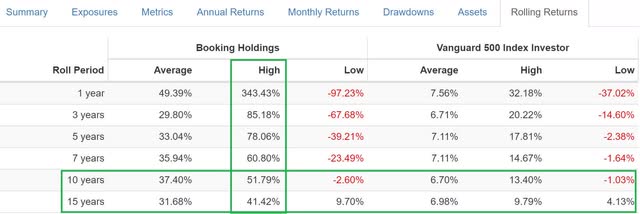 (Source: Portfolio Visualizer)
From bear market lows, such as the bottom of the tech crash, Booking earned investors 41.4% CAGR total returns over the next 15-years.
- 41.4% CAGR over 15 years = 180X your money
Such outperformance usually is usually sign of a very high-quality company.
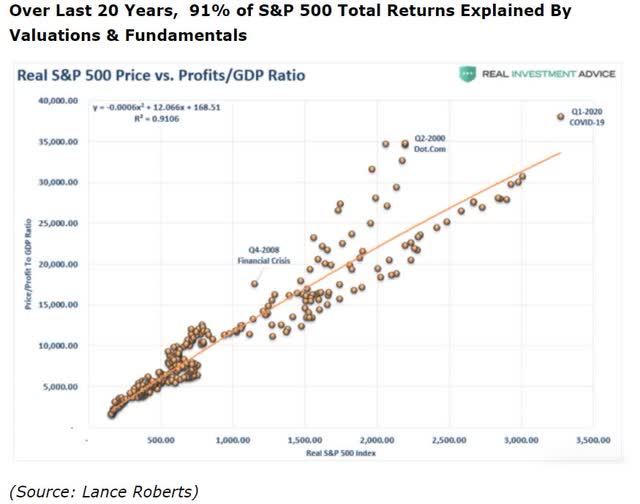
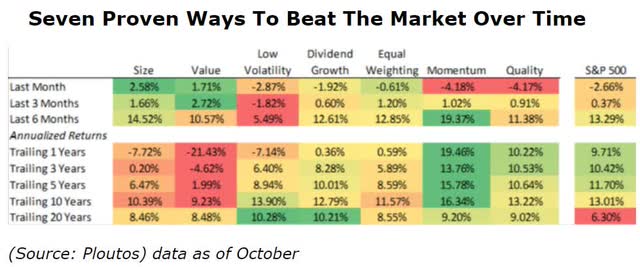 As Ben Graham pointed out, in the long-term the market is a weighing machine that 91% of the time correctly “weighs the substance of a company”. Quality is one of the seven proven alpha factors that consistently beat the market over time.
So let’s begin our quality assessment of Booking with its safety score.
Safety: 89% = 5/5 Very Safe
- 22 of 38 safety metrics apply to BKNG
- BKNG scores 89%
- earning it a 5/5 balance sheet safety rating
| Safety Rating | Dividend Kings Safety Score (38 Safety Metric Model) | Approximate Dividend Cut Risk (Average Recession) |
Approximate Dividend Cut Risk In This Recession |
| 1 (unsafe) | 0% to 20% | over 4% | 16+% |
| 2 (below average) | 21% to 40% | over 2% | 8% to 15% |
| 3 (average) | 41% to 60% | 2% | 4% to 8% |
| 4 (above-average) | 61% to 80% | 1% | 2% to 4% |
| 5 (very safe) | 81% to 100% | 0.5% | 1% to 2% |
| BKNG | 89% | NA | NA |
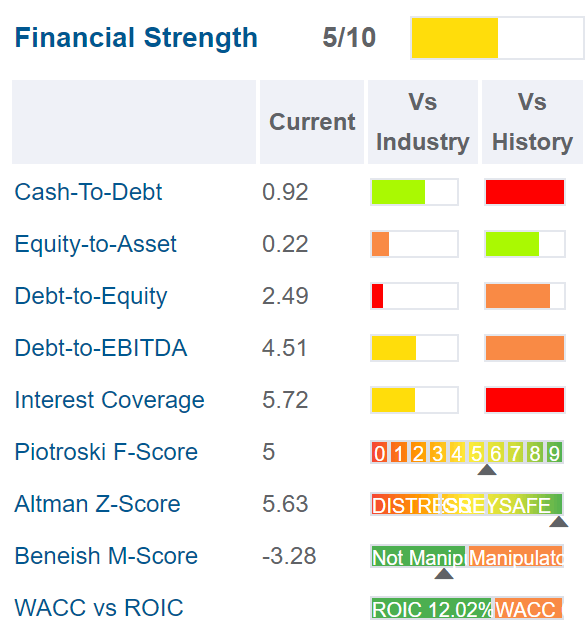
(Source: Gurufocus)
With domestic air travel down about 65% and global travel down 85%, it’s no surprise that BKNG’s balance sheet has come under stress during this pandemic.
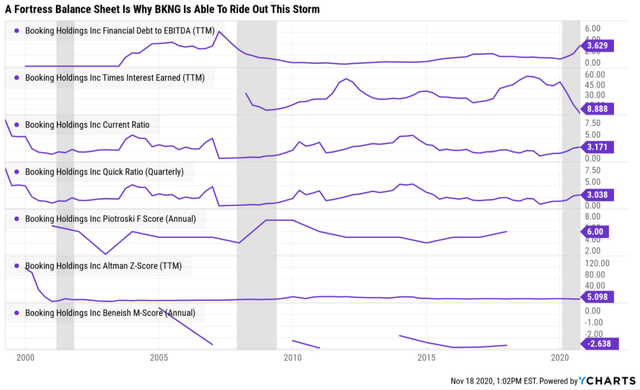
However, coming into the recession BKNG had
- a mountain of cash: $11.2 billion as of Q3
- $11.8 billion in total debt
- $600 million net debt
BKNG has been able to weather this storm while retaining the confidence of the rating agencies and bond investors.
- S&P credit rating: A- negative outlook = 2.5% 30-year bankruptcy risk
- Moody’s credit rating: A3 (A- equivalent), negative outlook = 2.5% bankruptcy risk
BKNG has already started to recover as seen by some of its key debt metrics.
- Q3 debt/EBITDA: 2.8 vs 3.0 or less safe according to rating agencies vs 1.3 13-year median
- interest coverage: 9.5 vs 8+ safe vs 23.3 13-year median
It’s advanced accounting metrics also show it’s in a strong position, which will almost certainly rise from the ashes of this recession to soar to new heights.
- F-score: 5 vs 4+ safe vs 6 13-year median = low short-term bankruptcy risk
- Z-score: 5.65 vs 1.81 safe, 3+ very safe vs 6.14 13-year median = very low long-term bankruptcy risk
- M-score: -3.28 vs -2.22 or less safe vs -2.52 13-year median = low accounting fraud risk
As far as safety goes, even in this pandemic, those owning BKNG have been able to sleep well at night.
Business Model: 3/3 Wide & Stable Moat
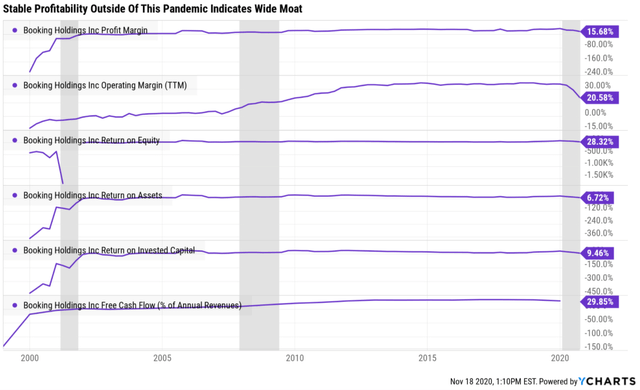
I define a wide moat company as the ability to generate relatively stable profitability (adjusting for industry cycles) in the top 25% of peers over time.
Outside of this pandemic, BKNG’s profitability is highly stable. How does it compare to its rivals?
(Source: Gurufocus)
Even during the year from hell for travel companies, BKNG stands a titan of profitability.
| Metric | Industry Percentile | Travel & Leisure Companies More Profitable Than BKNG |
| Operating Margin | 93.24 | 57 |
| Net Margin | 90.97 | 76 |
| Return On Equity | 95.76 | 36 |
| Return On Assets | 87.51 | 105 |
| Return On Capital | 96.71 | 28 |
| Average | 92.84 | 60 |
(Source: Gurufocus)
There are just 60 travel companies in the world more profitable than BKNG over the past 12 months. And as far as returns on capital go just 28.
 (Source: Imgflip)
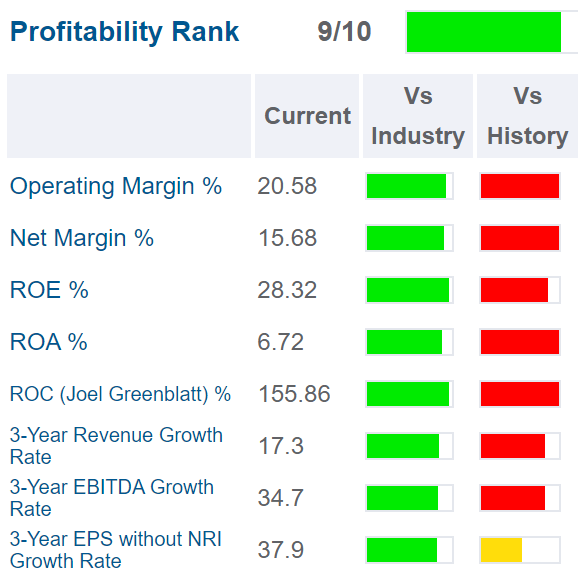
Return on capital is Joel Greenblatt’s gold standard proxy for quality and moatiness.
- ROC = annual pre-tax profit/operating capital (all the money it takes to run the business)
- 8% ROC is considered the rule of thumb for average quality companies (because the weighted cost of capital for the S&P 500 is about 8% over time)
- 80% ROC is the average for 9/11 quality blue-chips
- 127% ROC is the average for 11/11 quality Super SWANs
- BKNG’s TTM ROC is %, due to very negative numbers in Q2
- BKNG’s 13-year median ROC is 1,616% = about 160X that of its peers (outside recessions)
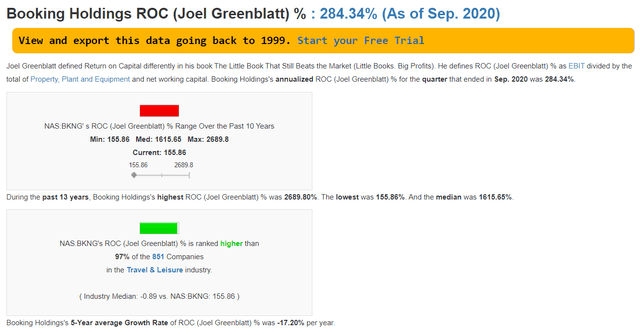
(Source: Gurufocus)
Even during the worst year for global travel in modern history, BKNG’s ROC in Q3 was a stunning 284%. Its 13-year median of 1,616% means that historically, for every $1 it takes to run the business, BKNG generates $16.16 in annual pre-tax profit.
- the highest historical ROC I’ve yet seen
- surpassing even AZPN’s 1,326% (the highest 13-year median ROC on the DK Master List)
According to Joel Greenblatt, one of the greatest investors in history, BKNG is one of the highest quality companies on earth.
Its 89% safety score + these insanely great returns on capital alone are why I’m adding it to the Master List today. It also earns a potential spot on the Phoenix list, the only watchlist that I’m willing to invest my own money into during this recession.
But there is one final reason that Booking Holdings is as close to a “must own” stock (at the right price” as you can find on Wall Street.
Long-Term Dependability: 3/3 Exceptional
The old Dividend Kings management quality/dividend culture score is now the long-term dependability score which takes into account
- management quality (capital allocation over time)
- dividend track record (for dividend-paying companies)
- ESG scores + trends from MSCI
Since BKNG doesn’t pay a dividend, let’s consider its management quality.
Based on its ability to maintain a wide and stable moat for 20 years, I would rate management quality exceptional. Morningstar agrees saying,
We see Booking’s management and allocation of capital as strong, resulting in an Exemplary stewardship ranking.
Booking’s execution and competitive positioning has not missed a beat with Glenn Fogel taking over as CEO in 2017. Fogel has 17 years of industry experience, including spending the last several years at Booking in development and strategic planning roles.
We see Jeffery Boyd remaining chairman of the board as a positive, given that the former CEO was paramount in making Booking the dominant OTA that it is today, in our opinion. For instance, when Boyd took over as CEO in 2001, the company primarily consisted of Priceline.com in the United States and an opaque Name Your Own Price service that appealed to budget travelers.
Boyd saw the massive opportunity in international markets and acquired Booking.com in 2005 for only $135 million and Agoda in 2007. With our stand-alone valuation for Booking.com around $90 billion (which is based on our fair value estimate enterprise value and our assumption that Booking.com is 85% of cash flow generation), the acquisition is one of the most successful acquisitions of a foreign company by an American company in the past 50 years.
We are favorable on Booking’s capital allocation. The company has been opportunistic with share repurchases, aggressively buying back its stock on share price pullbacks, when we find valuation at attractive levels. Meanwhile, the company focuses on reinvesting in its network through expanding travel supply and improving user experience, which we believe supports its long-term competitive position.
That said, the primary risk we see to our rating is from significant value-destructive acquisitions; for instance, although the purchase of OpenTable should offer moat-enhancing effects and is relatively small versus Booking’s total business, we view the $2.6 billion purchase price as relatively expensive, which was supported by last year’s $941 million impairment charge on the business.” – Morningstar (emphasis added)
That’s quite an impressive resume management has, but there is one final dependability metric to consider.
Companies with strong ESG profiles may be better positioned for future challenges and experience fewer instances of bribery, corruption, and fraud.” – MSCI
ESG is NOT simply the purview of “woke” and “on-trend” hippy millennials trying to virtue signal to impress Silicon Valley venture capitalists.
According to the world’s best risk-assessors, ESG metrics are a critical component of a company’s overall risk profile. Here’s who considers ESG important and builds it into their safety models.
- BlackRock
- MSCI
- S&P
- Fitch
- Moody’s
- DBRS (Morningstar’s credit rating agency)
The reason some investors consider ESG to be political is that some investors consider some industries to be inherently “evil” such as tobacco, energy, big tech, pharma, health insurers, fast-food, snack foods, and defense contractors.
- such opinions are personal and based on individual ethics
- ESG scores as calculated by institutions are quantitatively based and focused on only fundamental risks to the underlying business
- they are compared against industry peers and as objective as can be realistically expected
Personal ethical or political opinions are not something rating agencies or asset managers care about.
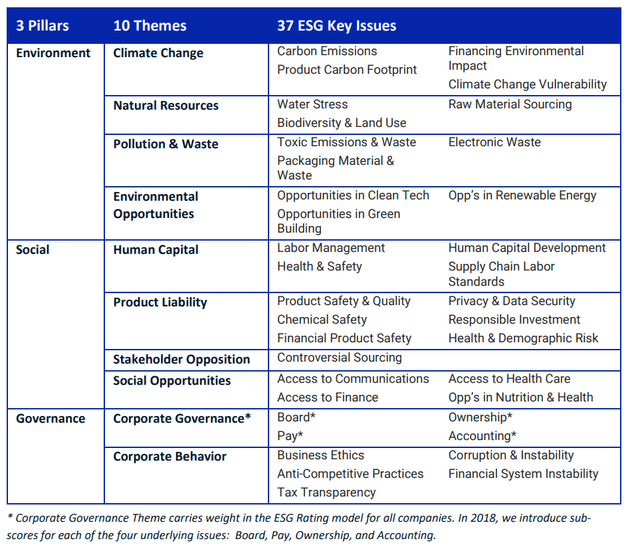
MSCI rates over 2,800 global companies on 37 ESG metrics, using a quantitative and qualitative approach, just as all the rating agencies do, and Ben Graham recommended.
Our global team of 185 experienced research analysts assesses thousands of data points across 37 ESG Key Issues, focusing on the intersection between a company’s core business and the industry issues that can create significant risks and opportunities for the company. Companies are rated on an AAA-CCC scale relative to the standards and performance of their industry peers…
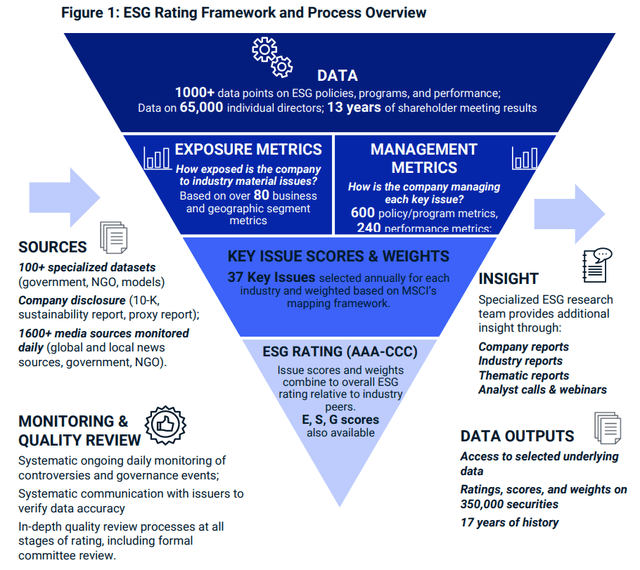
The MSCI ESG rating model seeks to answer four key questions about companies:
• What are the most significant ESG risks and opportunities facing a company and its industry?
• How exposed is the company to those key risks and/or opportunities?
• How well is the company managing key risks and opportunities?
• What is the overall picture for the company and how does it compare to its global industry peers?” – MSCI
(Source: MSCI)
The ESG scores you find from the best risk-assessors in the world are not opinions based on political correctness. They use a quantitative approach to fundamental company risk analysts. One based on decades of historical data pertaining to minimizing the risk of fundamental deterioration, bankruptcy, and stock/bond investors getting wiped out.
MSCI’s 185 analysts cover about 2,800 companies with ESG scores, and BKNG is one of them.
- when ESG scores are not available we use just management quality + dividend track record
- dividend track record is based on the Graham standard of quality & excellence
- also based on the Justin Law (keeper of David Fish’s CCC list) standard of quality & excellence (derived from Pandemic dividend cut data)
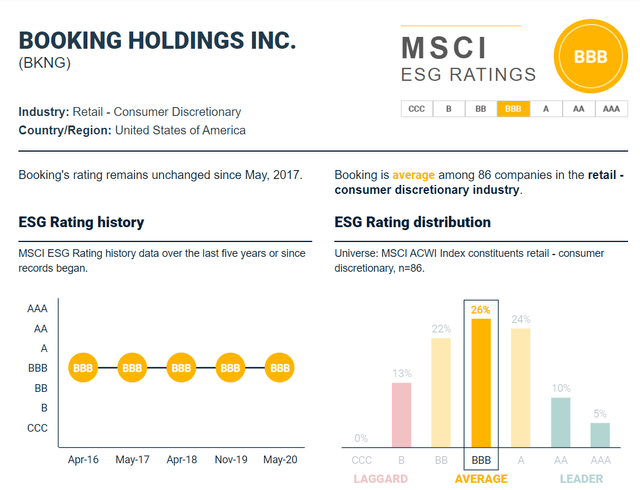
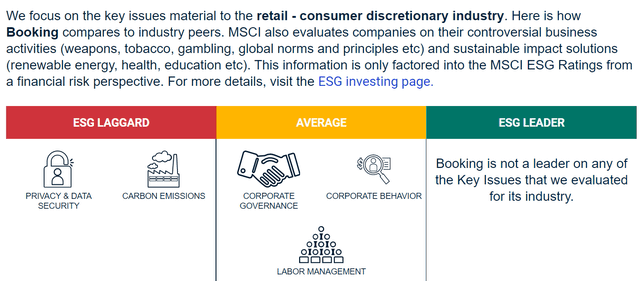
(Source: MSCI)
No companies are perfect when it comes to long-term sustainability and MSCI’s team of 185 industry experts consider it average as far as ESG goes. However, that, combined with its stable ESG score trend over five years is enough to earn BKNG a 3/3 exceptional dependability score from Dividend Kings.
BKNG Dividend Kings Long-Term Dependability Score
| Company | DK Long-Term Dependability Score | Interpretation | Points |
| S&P 500/Industry Average | 63% | Average | 2 |
| Non-Dependable Companies | 26% or below | Poor | 1 |
| Relatively Dependable Companies | 27% to 73% | Below to Above-Average | 2 |
| Very Dependable Companies | 74+% | Exceptional Dependability | 3 |
| BKNG | 80% | Exceptional Dependability | 3 |
From its historical returns, I suspected BKNG was a Super SWAN, and this quantitative and qualitative analysis confirms it.
- 5/5 safety
- 3/3 wide and stable moat
- 3/3 exceptional long-term dependability
- 11/11 quality Super SWAN (as close to a perfect company as exists on Wall Street)
So now as I add BKNG to the Dividend Kings Master List, let’s consider its growth potential and valuation, to see whether the highest quality company I’ve ever seen (by Joel Greenblatt’s definition) is a potentially good buy today.
Booking Holdings Consensus Growth Estimates
| Metric | 2020 consensus growth | 2021 consensus growth | 2022 consensus growth |
2023 consensus growth |
| EPS | -98% | 3437% | 83% | 28% |
| Owner Earnings (Buffett smoothed out FCF) | -44% | 74% | 23% | NA |
| Operating Cash Flow | -106% | 1322% | 43% | 30% |
| Free cash flow | -100% | 50200% | 94% | NA |
| EBITDA | -85% | 281% | 66% | 19% |
| EBIT (pre-tax profit) | -113% | 500% | 81% | 22% |
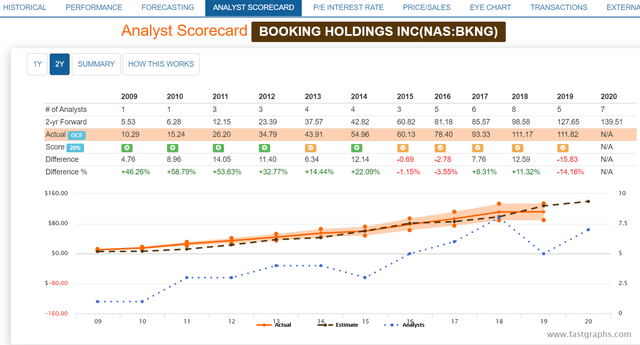
(Source: F.A.S.T Graphs, FactSet Research)
Due to being one of the most pandemic affected companies on earth, BKNG’s 2021 and 2022 recovery growth rates are expected to be sensational. 50,200% FCF growth in 2022 is among the highest ever recorded in human history, for any company.
From the few analysts willing to offer a 2023 estimate, we can see that fast-growth is expected to continue long after the pandemic is over.
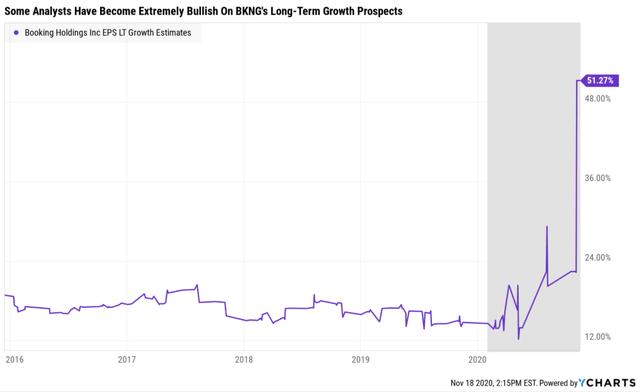
An unknown number of analysts (out of 27 that cover it on Wall Street) think BKNG might be able to grow at 51% CAGR over the long-term.
(Source: F.A.S.T Graphs, FactSet Research)
Since BKNG has never grown that fast since its 2000 IPO, I will consider that an outlier estimate.
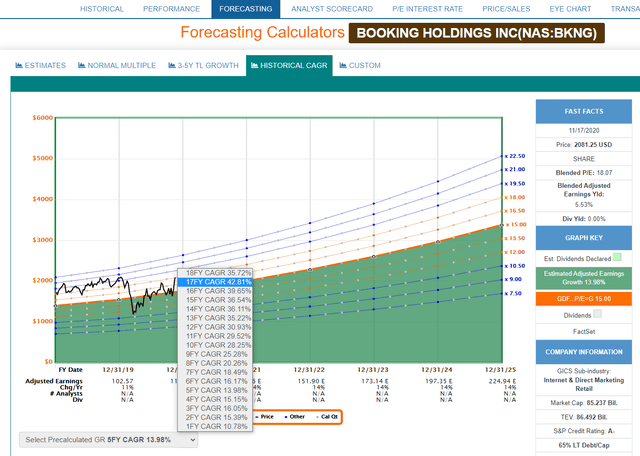
- FactSet long-term median consensus (5 analysts): 11.0% CAGR
- 4-year consensus operating cash flow growth consensus: 15.0% CAGR (including hyper-growth years through 2023)
BKNG’s recent historical growth rates, of 11% to 20% CAGR, indicate that the 11.0% CAGR growth consensus from FactSet is likely to be the most accurate.
As is the case with many fast-growing tech companies, operating cash flow tends to be the easiest for analysts to model and has the smallest historical analyst margins of error.
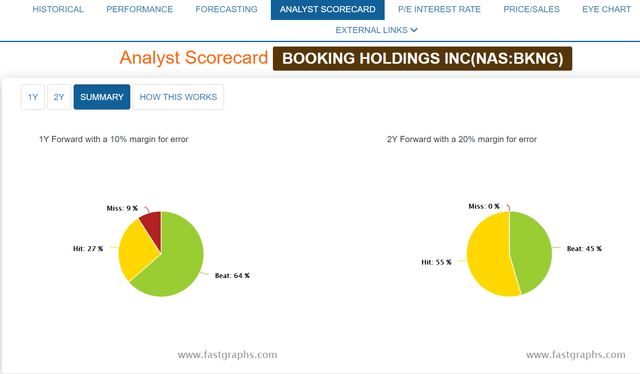
- historical margin of error 15% to the downside, 60% to the upside
- Long-term growth consensus: 11.0% CAGR
- the margin of error adjusted growth consensus: 10% to 18% CAGR
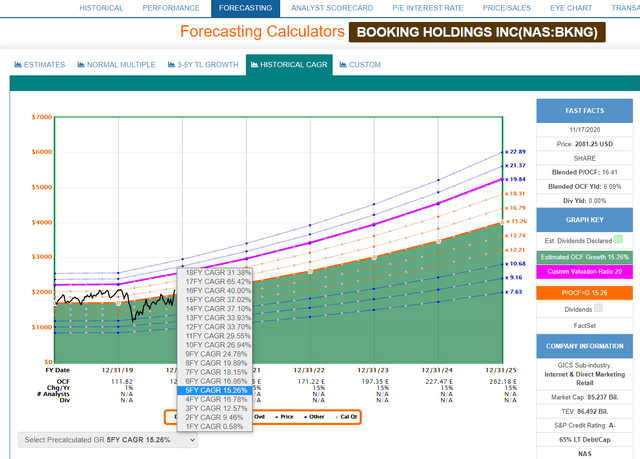 (Source: F.A.S.T Graphs, FactSet Research)
10% to 18% CAGR consensus operating cash flow is indeed reasonable given the company’s secular global growth catalysts and historical growth rates.
Booking Holding Historical Market-Determined Fair Value
| Metric | Historical Fair Value Multiples (9 years) | 2020 | 2021 | 2022 | 2023 |
| Earnings | 21.6 | $34 | $1,209 | $2,214 | $2,842 |
| Owner Earnings (Buffett smoothed out FCF) | 20.1 | $1,192 | $2,073 | $2,558 | NA |
| Operating Cash Flow | 19.5 | NA | $1,645 | $2,346 | $3,061 |
| Free Cash Flow | 20.7 | NA | $1,409 | $2,733 | NA |
| EBITDA | 17.3 | $363 | $1,381 | $2,299 | $2,733 |
| EBIT (Pre-Tax Profit) | 18.8 | NA | $1,220 | $2,208 | $2,697 |
| Average | $91 | $1,439 | $2,378 | $2,826 | |
| Current Price | $2,093.18 | ||||
|
Discount To Fair Value |
-2203% | -46% | 12% | 35% | |
| Upside To Fair Value | -96% | -31% | 14% | 35% | |
|
Annualized Total Return Potential |
-100% | -29% | 6% | 10% |
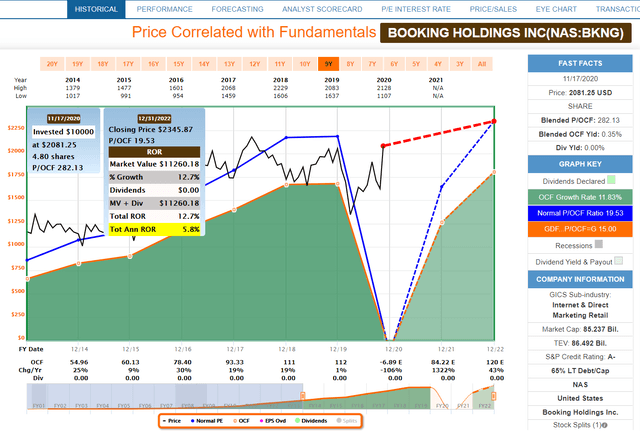
(Source: F.A.S.T Graphs, FactSet Research)
BKGN is an extreme case since the almost complete collapse of fundamentals in 2020 is expected to be followed by some of the fastest growth rates in recorded human history next year and sensational recovery growth in 2022 as well.
If you buy BKNG, at what appears to be extremely overvalued levels relative to next year’s fundamental consensus, you can still potentially earn 10% CAGR total returns if BKNG grows as expected through 2023.
BKNG 2022 Consensus Return Potential
(Source: F.A.S.T Graphs, FactSet Research)
If BKNG grows as expected and returns to its historical mid-range 19.5 P/ operating cash flow by the end of 2022, investors would see 5.9% CAGR total returns.
- vs -3.4% CAGR S&P 500 2022 consensus return potential (S&P is 37% overvalued)
BKNG 2025 Consensus Return Potential
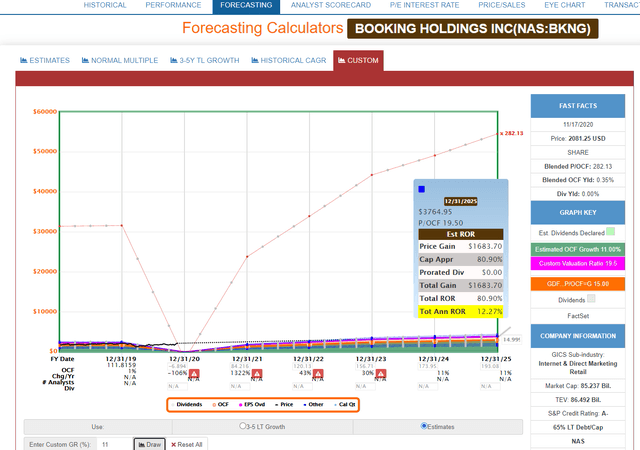
(Source: F.A.S.T Graphs, FactSet Research)
Similarly, if we look at the 5-year analyst consensus return potential, it’s 12.3% CAGR.
- 5-year S&P 500 consensus return potential is 3.3% CAGR
So for Dividend King’s Master List and Research Terminal here is how I’m solving this unique conundrum.
- use 2022 fair value of $2,378
- but instead of 5% margin of safety for an 11/11 quality Super SWANs use 20% margin of safety for a potentially good buy for BKNG which is speculative during this pandemic
- speculative companies, regardless of quality have 2.5% or less max portfolio risk cap recommendations
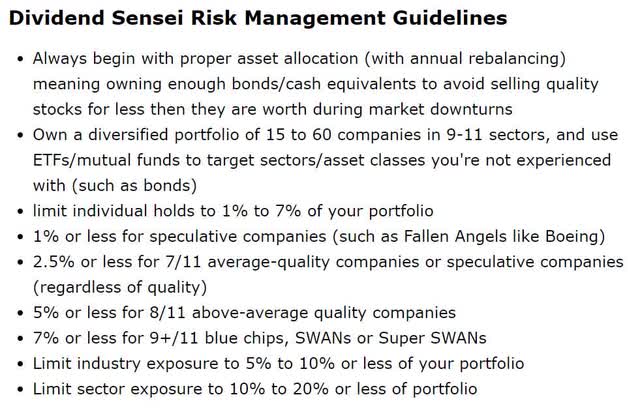 These are the risk-management guidelines that
- I’ve been perfecting over seven years
- with input from colleagues with nearly 100 years of asset management experience
- that have been stress-tested about 275 times
- using historical market data
- and JPMorgan’s future risk assessment scenarios
- and 30 and 75 year Monte Carlo simulations
- all Dividend Kings portfolios use these risk-management guidelines
- 100% of my life savings is entrusted to these guidelines
Since BKNG has the highest 13-year median return on capital on the entire Master List (by about 300%) it deserves to join the Phoenix high-priority limit list.
I set real money limits for the DK Phoenix portfolio based on our highest conviction recommendations in five categories.
- Highest-Yielding Phoenix Companies
- Fastest-Growing Phoenix Companies
- Lowest PEG Phoenix Companies
- Highest Return On Capital Phoenix Companies
- 11/11 Super SWANS
BKNG is both a Super SWAN and the king of high return on capital companies.
BKNG Phoenix Limits
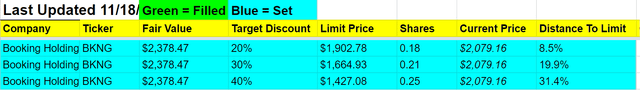
(Source: Dividend Kinds Limit Price Calculator/Phoenix Limit Tool) updated each Saturday, Make A Copy To Edit The Companies And Calculate Your Own Personal Limit Prices, blue = set, green = filled, BKNG fair value and discount are for 2022 fair value
These are the limits I’ve just set for Booking Holdings, which I would be very happy to own at a 8.5% lower price.
- 5-year consensus return potential: 14.1% CAGR
- with one of the strongest and highest quality companies on earth
- one of the lowest fundamentally risky ways to earn potentially earn 13% CAGR returns (4X what the S&P 500 is likely to deliver) you can find today
BKNG Risk-Adjusted Expected Return Calculator (From The Potentially Good But Speculative Price Of $1903)
| 5-Year Consensus Annualized Total Return Potential | 14.1% |
| Conservative 50% Margin Of Error Adjusted Annualized Total Return Potential (from Chuck and JPMorgan) | 7.05% |
| Bullish 50% Margin Of Error Adjusted Annualized Total Return Potential | 21.15% |
| Conservative Probability-Weighted Expected Annualized Total Return (40% probability that analysts are wrong about any given company’s growth rate, according to Peter Lynch, John Templeton, and Howard Marks) | 4.23% |
| Bullish Probability-Weighted Expected Annualized Total Return (20% probability that analysts are wrong about any given company’s growth rate) | 16.92% |
| Mid-Range Probability-Weighted Expected Annualized Total Return Potential | 10.58% |
| Ratio vs S&P 500 | 4.27 |
| Bankruptcy Risk | 2.5% |
| Probability Of No Bankruptcy | 97.5% |
| Risk-Adjusted Expected Total Return | 10.31% |
| Ratio vs S&P 500 | 4.17 |
(Source: Dividend Kings Investment Decision Tool)
At that potentially good buy price of $1,903, BKNG has 10.3% CAGR 5-year risk-adjusted expected returns. From a far higher quality and safer company than the average S&P 500 firm.
BKNG Investment Decision Score (From The Current Price Of $2,079)
I never recommend a company, much less put my own money at risk, without first knowing exactly how prudent a potential investment it is relative to the S&P 500, most people’s default alternative.
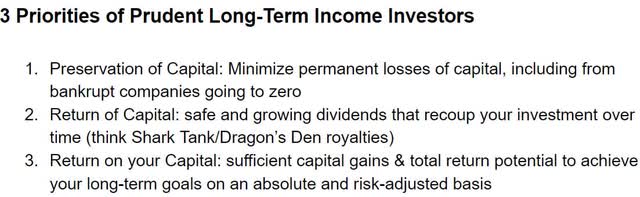
The investment decision score is based on valuation and the three core principles of all successful long-term investors.
| Goal | BKNG | Why | Score |
| Valuation | potentially reasonable buy | 12% undervalued for 2022 | 3/4 |
| Preservation Of Capital | Excellent | A- negative outlook credit rating from all 3 agencies, 0.6% long-term bankruptcy risk | 7/7 |
| Return Of Capital | NA | Doesn’t Pay A Dividend/ historical yield below 1.5% | NA |
| Return On Capital | Excellent | 9.0% RAER vs 2.5% S&P 500 | 10/10 |
| Relative Investment Score | 95% | ||
| Letter Grade | A excellent | ||
| S&P | 73% = C (market-average) |
(Source: Dividend Kings Investment Decision Tool)
Even today BKNG is a potentially excellent long-term Super SWAN quality growth investment.
- over the very long-term (30+ years, when valuations cancel out) analyst return consensus 11.0% CAGR
- vs 8.0% CAGR S&P 500 and 9.5% CAGR dividend aristocrats
That’s assuming you’re comfortable with its risk profile and own it as part of a diversified and prudently risk-managed portfolio.
BKNG Risk Profile Summary
We rate Booking’s uncertainty as high. Risks surrounding additional waves of COVID-19 cases and elongated time until an effective treatment and vaccine are globally available remain, which could delay our forecast recovery in demand. But this should not impact Booking’s uncertainty rating unless travel demand once again returns to near zero for an extended period of time, leading to potential needs for incremental liquidity, which perhaps could occur at value destructive levels.
Booking derives most of its sales from international markets, exposing it to exchange-rate fluctuations that are often near term yet can meaningfully affect sales and profitability.
Rate-parity clauses prevent hoteliers from offering cheaper rates on their websites than are offered on the OTA websites. Full removal of rate parity could create a competitive environment.
Focused entry from companies such as Google, Amazon, Alibaba, and Facebook could have a meaningful impact on Booking’s growth.
The travel industry is cyclical and affected by changes in economic growth, which can result from exogenous events like airborne illnesses. In 2009, Booking’s booking growth slowed to 26% from 53% reported in 2008.
The spread of the COVID-19 represents a material headwind to travel demand in 2020, and we estimate Booking’s revenue to decline 53% this year. Additionally, terrorist attacks can lead to a near-term disruption in bookings.
Potential European regulation around networks could also impact competitive positioning for Booking and Airbnb. Finally, changes to the innovation tax credits could increase tax provisions, and increase Booking’s corporate tax rate beyond the roughly current 20% level.” – Morningstar
Teladoc: One Of The Most Hyped Growth Stocks On Wall Street Is One I Can’t Recommend
There are few hotter stocks on Wall Street right now than TDOC. Teladoc is the mirror image of BKNG, with the pandemic immensely accelerating its growth.
Business Summary
Teladoc Health is a virtual health provider with a telehealth platform delivering 24-hour, on-demand healthcare via mobile devices, the Internet, video, and phone.
Its platform connects members with a network of physicians and behavioral health professionals. Most of the company’s revenue is generated on a subscription basis (per member per month); the balance comes from visit fees.
Since its inception, Teladoc has primarily partnered with employers, health plans, and health systems to offer network access to their members; most recently, the company has also started to market directly to consumers while expanding its service portfolio. The cornerstone of Teladoc’s business is to provide healthcare access to members in real-time to avoid excessive health plan costs.” – Morningstar
On October 30th, TDOC and Livongo merged in an $18.5 billion all-stock deal, that management believes will help it achieve superior economies of scale faster and hopefully dominate this new but rapidly growing industry.
The merger would combine Livongo’s platform for managing chronic conditions, such as diabetes and heart disease, with telemedicine. The two businesses are expected to be complementary, with Livongo’s platform offering a way to keep patients engaged in between telehealth visits. They also have little overlap between their current customers — only 25%.” – Medcitynews
TDOC will now be a partially vertically integrated telepresence provider, attempting to streamline the US medical system which accounts for 20% of US GDP (about $4 trillion per year).
As Morningstar explains, TDOC’s first-mover advantage (it was founded in 2002 by a NASA flight surgeon) is the reason that it’s gobbling up market share.
The company’s scale is a key differentiator, as competitors are significantly smaller and incapable of offering physician visits on demand. Teladoc’s global infrastructure leveraging 50,000 credentialed providers is equipped to match patients within 10 minutes. This rapid response time is the key to avoiding costly visits to the emergency room.” – Morningstar
But how does TDOC score on the Dividend Kings safety and quality model?
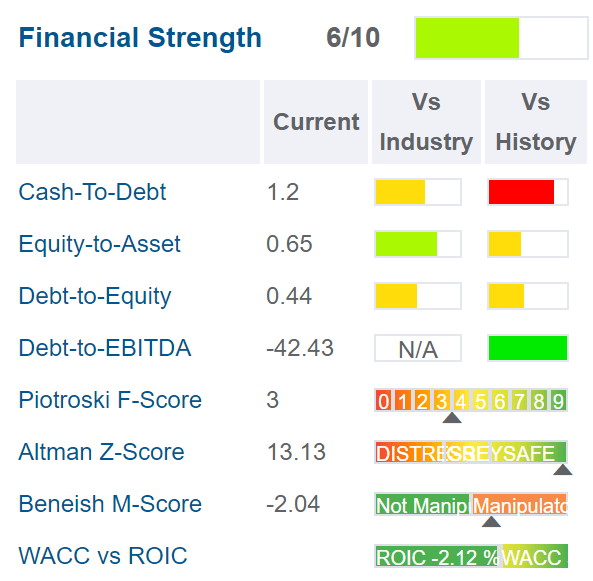
Safety: 3/5 Average
- 20 of 38 safety metrics apply to TDOC
- TDOC scores 48%
- earning it a 3/5 safe rating
Dividend Kings Safety Score On TDOC
| Safety Rating | Dividend Kings Safety Score (38 Safety Metric Model) | Approximate Dividend Cut Risk (Average Recession) |
Approximate Dividend Cut Risk In This Recession |
| 1 (unsafe) | 0% to 20% | over 4% | 16+% |
| 2 (below average) | 21% to 40% | over 2% | 8% to 15% |
| 3 (average) | 41% to 60% | 2% | 4% to 8% |
| 4 (above-average) | 61% to 80% | 1% | 2% to 4% |
| 5 (very safe) | 81% to 100% | 0.5% | 1% to 2% |
| TDOC | 48% | NA | NA |
- TDOC has $1.2 billion in cash
- $990 million in total debt (98% long-term, junk bonds)
- 7.0% average interest costs
- 7.1% average long-term borrowing costs
TDOC doesn’t pay for a credit rating but there are ways to accurately estimate what a company would be rated if it did. Rating agencies tell their clients that for non-rated companies you should
- use current and historical debt metrics vs safety guidelines to estimate an effective credit rating
- confirm with average long-term borrowing costs
- because bond investors know the safety guidelines by heart
- and use them to determine debt covenants written into the bonds themselves
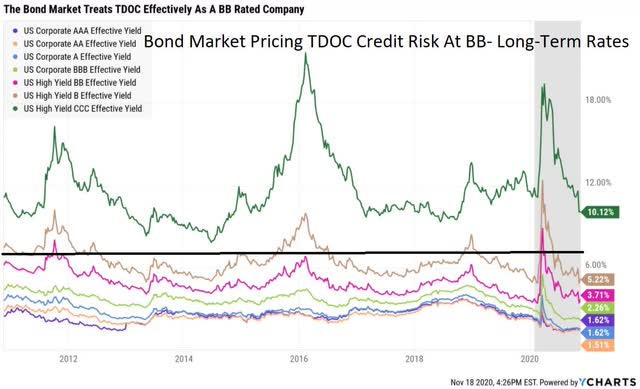
The so-called “smart money”, the bond market, is pricing TDOC’s default risk as it were a BB – rated company.
(Source: Gurufocus)
The company has a small net cash position, which is the reason its Z-scores are so strong, both now and historically. It’s also why its current and quick ratios (short and very short-term solvency ratios) are historically very strong.
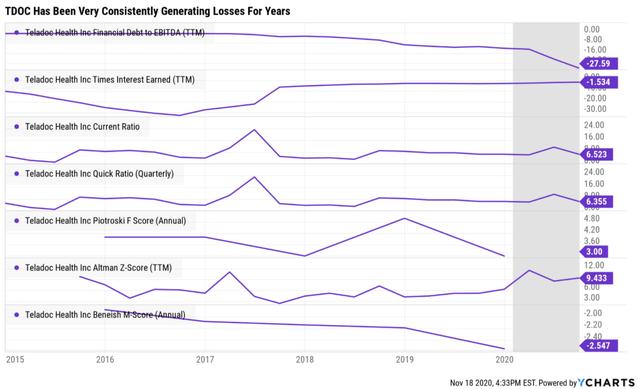
However, TDOC has been consistently generating losses and thus scores very poorly on a model designed around credit rating safety guidelines.
| Credit Rating | 30-Year Bankruptcy Probability |
| AAA | 0.07% |
| AA+ | 0.29% |
| AA | 0.51% |
| AA- | 0.55% |
| A+ | 0.60% |
| A | 0.66% |
| A- | 2.5% |
| BBB+ | 5% |
| BBB | 7.5% |
| BBB- | 11% |
| BB+ | 14% |
| BB | 17% |
| BB- | 21% |
| B+ | 25% |
| B | 37% |
| B- | 45% |
| CCC+ | 52% |
| CCC | 59% |
| CCC- | 65% |
| CC | 70% |
| C | 80% |
| D | 100% |
(Sources: Dividend Kings Investment Decision Tool, S&P, University of St. Petersberg)
What the bond market is saying is that there is approximately a 21% probability that TDOC will go bankrupt and its stock to zero.
- all junk bond rated companies (actual and effective) are speculative
The good news is that analysts expect that TDOC will become profitable…eventually.
- EPS profitability expected in 2023
- operating cash flow profitability since 2019
- free cash flow profitability since 2019
- EBITDA profitability expected in 2020
- EBIT profitability expected in 2022
Unfortunately, it’s going to take a long time before TDOC’s leverage falls to safe levels that could earn it an investment-grade credit rating.
- $99.5 million 2020 EBITDA consensus = 10.0 debt/EBITDA
- $155.5 million 2021 EBITDA consensus = 6.4 debt/EBITDA
- $233 million 2022 EBITDA consensus: 4.2 debt/EBITDA
- $371 million 2023 EBITDA consensus: 2.7 debt/EBITDA
These numbers are assuming TDOC’s current $990 million total debt stays the same. Given its growth ambitions and the fact that its funded 30% of historical growth with long-term debt, that is unlikely.
- TDOC likely won’t have an investment-grade balance sheet until 2024 or 2025 at the earliest
We can run the same calculations based on its interest coverage, which is EBIT (pre-tax profits)/interest costs.
- TDOC is currently paying $69 million in interest (8% of TTM revenue)
What do analysts expect it to generate in future EBIT?
- -$62 million in 2020
- -$3 million in 2021
- $42 million in 2022: 0.6 interest coverage ratio vs 8+ safe
- $196 million in 2023: 2.8 interest coverage vs 8+ safe
Again, 30% of TDOC’s growth has been funded with long-term debt so chances are good that those interest coverage ratios will actually be lower as its interest costs will continue to climb.
- TDOC’s interest coverage ratio isn’t likely to reach investment-grade safe levels until 2025 or 2026 at the earliest
Basically, TDOC has a 79% probability of making it to long-term sustainability and a 21% probability of going to zero. This is NOT a good investment for extremely conservative income investors looking to add growth to their portfolio.
- 1.0% or less max portfolio risk cap recommendation (very speculative)
Another thing to consider that makes TDOC very speculative, rather than just speculative is its troubling Beneish M-score.
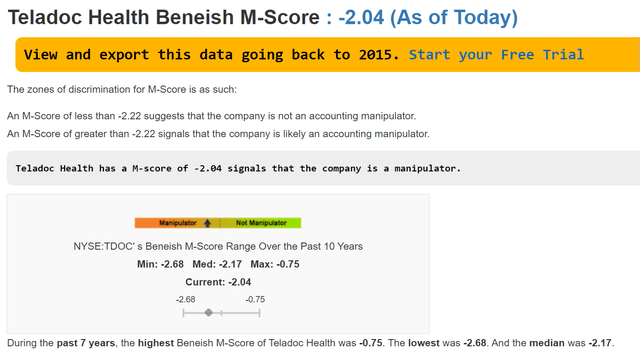
(Source: Gurufocus)
- M-score is 76% historically accurate at catching accounting fraud
- 82.5% historically accurate at finding companies with honest accounting
- -2.22 or less M-score = low accounting fraud risk
- TDOC’s Q3 M-score was -2.04
- TDOC’s 7-year median M-score has been -2.17
- current and historical elevated accounting fraud risk
In 1998, a group of Cornell University business students used the Beneish model to predict that Enron Corporation was manipulating their earnings.
At the time, Enron stock was trading at only about half ($48 per share) of the price to which it eventually climbed ($90) before its dramatic fall into ruin and bankruptcy a few years later in 2001. At the time the Cornell students sounded the alarm, no one on Wall Street heeded their advice.” – Investopedia
A single quarterly M-score is not necessarily a reason for alarm. However, if a company’s long-term median M-score is above -2.22 that indicates a significantly elevated risk that the company is committing fraud, and potentially the stock could wind up at zero.
- without a credit rating neither S&P, Fitch, or Moody’s industry experts are vouching for TDOC’s accounting.
Business Model: 1/3 No Moat (Positive Trend)
We do not believe Teladoc has an economic moat.
Although Teladoc has established itself as the national telehealth leader with global reach, the virtual care delivery market remains fragmented and the current offering and infrastructure are not mature enough to support economic profits.
While we assign a no-moat rating, we see some characteristics that could make Teladoc a moat worthy business as it matures. Notably, we believe the foundation for intangible assets arising from the knowledge base necessary to navigate complex healthcare-related regulations and secure healthcare approvals in all 50 states is not a small hurdle for a potential competitor.
We also think scale matters in healthcare, and Teladoc is already the largest provider in a market where health insurers and self-funded employers have a vested interest in the company succeeding.” – Morningstar (emphasis added)
TDOC is currently not profitable and as far as EPS goes, the 25 analysts who cover it on Wall Street don’t expect it to be until 2023.
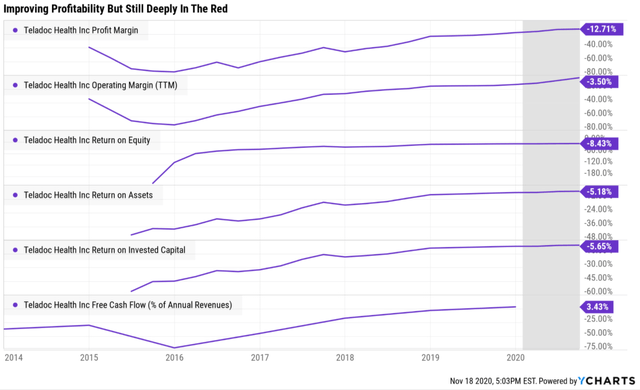
The good news is that profitability is expected to finally arrive within a few years, in all fundamental metrics. The bad news is that for now, TDOC’s current and historical profitability is pretty underwhelming.
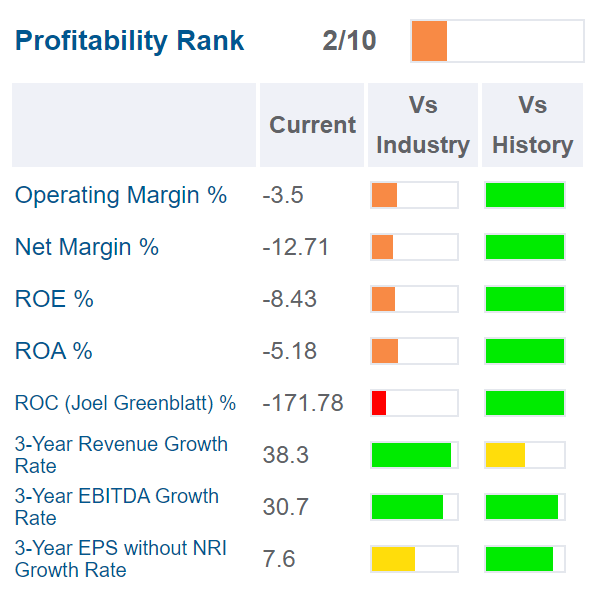
(Source: Gurufocus)
Remember how I said BKNG and TDOC were mirror images of each other?
- BKNG has seen its business gutted by the pandemic…yet is still generating incredible profits over the last 12 months
- TDOC’s business is booming…yet it’s losing tens of millions
BKNG’s ROC in Q3 was 284%. TDOC’s was -178%.
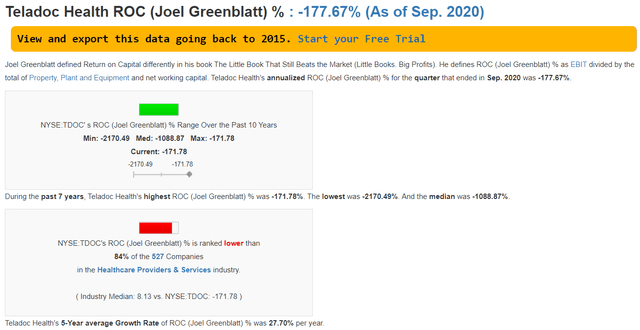
(Source: Gurufocus)
- of 527 major healthcare companies, just 85 have worse returns on capital than TDOC
- for every $1 it takes to run this business TDOC lost $1.78 in Q3 (annualized basis)
- for every $1 it takes to run this business TDOC has historically lost $10.89
Joel Greenblatt would not be impressed with TDOC and consider it a low-quality company. The quality of the business has been improving rapidly, 28% CAGR per year over the last 5-years, the pace of ROC improvement.
However, analysts don’t expect positive EBIT until 2022, meaning that it won’t generate positive ROC for another two years…at least. Since going public TDOC has never met analyst expectations for pre-tax profit.
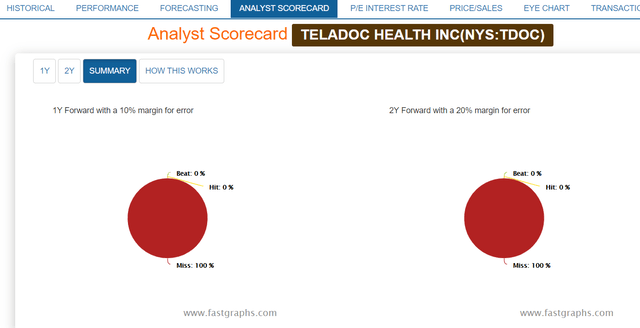
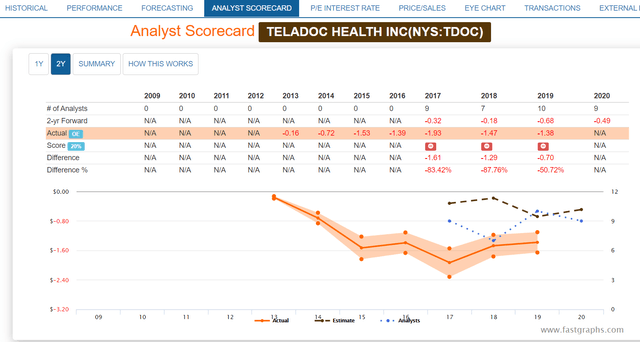
TDOC EBIT Analyst Scorecard
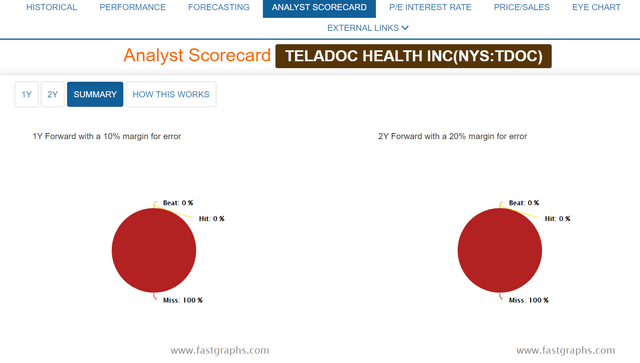
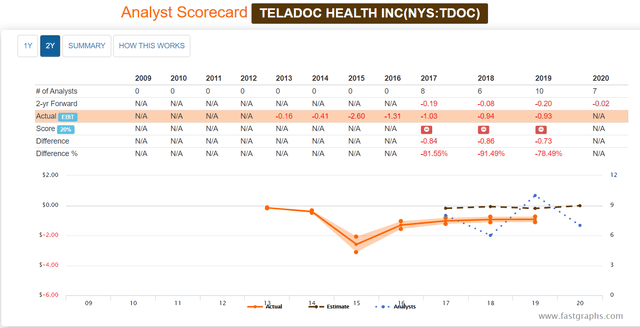
TDOC has historically missed EBIT estimates by a country mile, 82% in 2017, 91% in 2018, and 78% in 2019.
Remember that until its interest coverage reaches safe levels, it will be forced to borrow at junk bond rates, about 7%. The average return on invested capital for S&P 500 companies in 2019 was 13%.
- most large companies could borrow at 7% and still generate good returns on investment
- TDOC has to borrow large amounts of high-cost debt and is still generating -5.7% returns on investment.
- ROIC for TDOC has been relatively flat for years, inching less negative
- it could take longer for TDOC to become profitable than analysts think.
Speaking of missed expectations let’s take a moment to consider TDOC’s main appeal to investors, hyper-growth.
TDOC’s Growth Story Might Not Be As Attractive As You Think
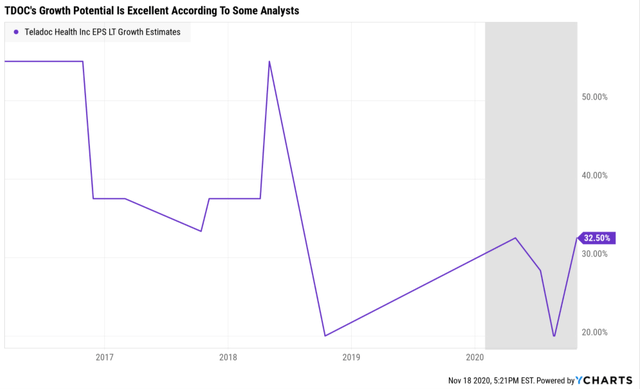
Some analysts are very bullish on TDOC’s growth prospects. The Ycharts long-term consensus is up to 32.5% CAGR since the latest earnings came out.
BUT other analysts are less optimistic.
- long-term FactSet median consensus (3 analysts): 20.0% CAGR
- Reuters’ 5-year EPS growth consensus (7 analysts): -0.9% CAGR
Another thing to consider is that when it comes to operating earnings expectations, TDOC’s track record is as bad as it is with pre-tax profits.
Since going public analysts have missed on two-year EPS forecasts by between 51% and 88%.
- TDOC’s margin of error adjusted long-term growth consensus range is -1% to 16% CAGR
While TDOC has the POTENTIAL for hyper-growth, I would certainly rather own BKNG, whose consensus growth range is 10% to 18% CAGR and which has a fortress balance sheet with A- credit ratings.
- TDOC’s risk of bankruptcy is 8.4X as great as BKNG’s
- and that’s assuming it’s not committing accounting fraud and its fundamental numbers can even be trusted
Long-Term Dependability: 2/3 Above-Average
It’s tough to judge management quality at the moment since TDOC has only been public for less than five years. I’m not the only one who thinks that.
We assign Teladoc a Standard stewardship rating. Overall, we find no material governance issues. Given that the company completed its initial public offering in June 2015, we do not have extensive experience with management. We do not anticipate any significant changes to stewardship with the integration of Livongo.” Morningstar
TDOC Dividend Kings Long-Term Dependability
| Company | DK Long-Term Dependability Score | Interpretation | Points |
| S&P 500/Industry Average | 63% | Average | 2 |
| Non-Dependable Companies | 26% or below | Poor | 1 |
| Relatively Dependable Companies | 27% to 73% | Below to Above-Average | 2 |
| Very Dependable Companies | 74+% | Exceptional Dependability | 3 |
| TDOC | 73% | Above-Average | 2 |
How can TDOC score so highly on dependability when it’s not profitable and has an elevated risk of accounting fraud and a 1 in 5 chance of going to zero according to the bond market?
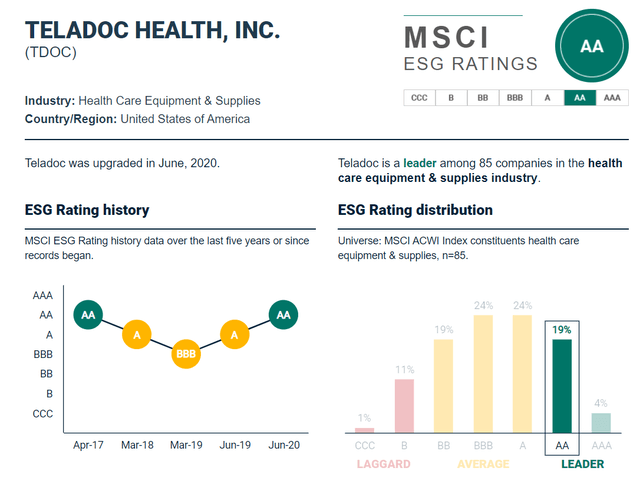
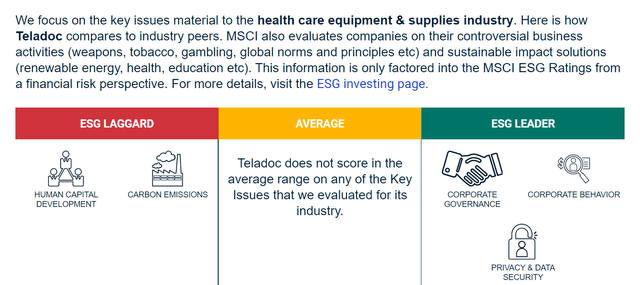
(Source: MSCI)
The 185 industry experts at MSCI that evaluate long-term sustainability consider TDOC to be in the top 23% of its industry. It has some major issues, especially retaining top-quality employees, but as far as corporate governance and fraud risk goes, MSCI considers it to be very low.
- While S&P, Fitch, and Moody’s won’t vouch for TDOC’s accounting, MSCI considers it to be reliable
Overall Quality: 6/11 Below Average Quality – Positive Trend
- 3/5 average safety
- 1/3 unprofitable business (though positive trend)
- 2/3 above-average long-term dependability
- 6/11 below-average quality (positive trend)
- very speculative
- 1.0% or less max portfolio risk cap recommendation
- 35% margin of safety for a potentially good buy
- assuming you’re comfortable with the risk profile of a very speculative company
TDOC Risk Profile Summary
We assign Teladoc a high uncertainty rating.
Teladoc trades at high multiples relative to peers. While the company is expected to produce revenue growth above the high end of peers and the premium may be justified, higher absolute valuation levels offer less room for missteps and therefore carry greater inherent risks, in our opinion.
At high valuation levels, companies can often become momentum stocks and be punished severely if they do not deliver against expectations, which are regularly higher than consensus figures indicate. Teladoc’s business-to-business relationships cater to large subscription bases from payer and self-funded employers, which means revenue is concentrated among the largest customers.
There is no revenue concentration from a risk standpoint, as there are no 10% customers, but this may become a concern as management continues to sell more memberships to existing customers. Teladoc has not reached profitability on a GAAP basis, nor do we contemplate a positive GAAP operating margin in our model until fiscal 2022. Teladoc faces competition from a variety of private companies and potentially from national healthcare systems.
As a healthcare company, Teladoc is heavily regulated and is governed by numerous federal and state/local entities with evolving standards. Teladoc benefits from its ability to operate as a legal structure, sequestering its provider network in a VIE (Teladoc Physicians, PA) which allows it to operate nationally without staffing full time.
The key challenge of this legal structure is the inability to staff enough physician hours to match rising demand while maintaining quality. Lastly, the company’s international operations are relatively small but are anticipated to be a larger contributor to growth and may pose operating risks, including currency risk, regulations of a different set of laws, and standards.” – Morningstar (emphasis added)
TDOC’s Valuation: High Uncertainty And No Margin Of Safety
We are increasing our fair value estimate to $183 per share from $153 to reflect the acquisitions of Livongo and InTouch.” – Morningstar
Morningstar’s fair value estimate is based on a discounted cash flow model, and they don’t disclose much of the details about what assumptions are going into that.
For non-profitable companies, especially momentum growth stocks like TDOC, I consider the Price/Sales ratio to be the most reasonable and prudent valuation metric.
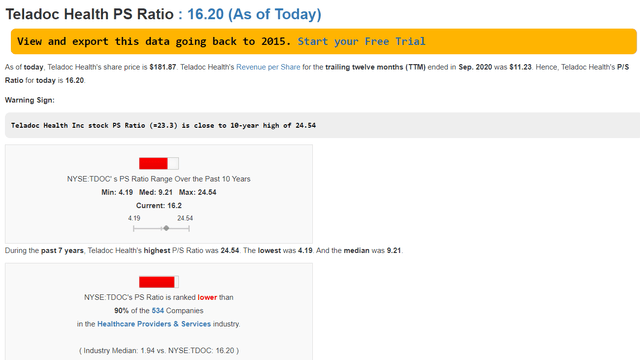
(Source: Gurufocus)
Specifically, by looking at the historical P/S ratio we can get a sense for how over or undervalued a company is. The median P/S ratio for this industry over the past year is 1.94.
- TDOC’s is 16.2
- vs 9.21 median since its IPO
- $11.23 TTM revenue per share
- X 9.21 median P/S since IPO = $103.43 market-determined fair value
- current price: $179
- margin of safety: -73%
- DK rating: potential trim/sell
Keep in mind that in 2000 the CEO of Sun Microsystems, one of the hottest tech stocks of the tech bubble, called investors paying 10X sales crazy.
That’s close to the historically normal price investors have been willing to pay for this non-profitable company with an elevated accounting fraud risk and an approximately 21% chance of going bankrupt.
Today investors are paying 16.2X sales or 76% more than this company’s market-determined fair value.
- TDOC potential good (but VERY speculative) buy price: $67
- 73% overvalued
- Poor reward/risk ratio
TDOC is a company that I don’t consider sufficient quality to even make it onto the DK Master List, much less the Phoenix list.
Bottom Line: Quality & Safety Are Always Priority One When Achieving Your Long-Term Financial Goals
 (Source: Imgflip)
Both Teladoc and Booking Holdings are beloved tech stocks that investors believe can make them rich over time.
However, after a thorough analysis of their fundamental quality, safety, business models, and long-term dependability I can only recommend Booking Holdings for conservative investors interested in potentially adding a promising growth stock to their diversified and prudently risk-managed portfolios.
While Booking is suffering now, its turnaround is already underway. Most importantly, it has the strong balance sheet to likely ride out even this 3rd and worst wave of the worst pandemic in over 100 years.
In contrast, Teladoc, while benefiting currently from the pandemic, is incredibly overvalued, trading at over 16X sales, isn’t expected to be profitable for years, has elevated accounting fraud risk, and approximately a 21% chance of going to zero.
The future is never certain in life, or on Wall Street. In finance, there are just three languages reputable and trustworthy professionals speak.
- probabilities
- margins of safety
- prudent risk-management for your needs
The smart investor understands that investing success is a matter of understanding and correctly pricing risk, which is what I’ve spent seven years learning to do.

I don’t claim to have all the answers, no person ever will. But a dedication to lifelong learning and constant improvements to my investing strategy, based on the time-tested lessons of the greatest investors in history is what I offer my readers.
 (Source: Imgflip)
All my recommendations are based on the best available facts and data, from reputable sources because ultimately 91% of long-term stock returns are a function of fundamentals.
If your facts and reasoning are right, and you are a disciplined long-term investor, who focuses on the five fundamentals that determine financial success, you never have to pray for luck.
 (Source: AZ quotes)
The disciplined and prudent long-term investor makes their own luck, by knowing what companies are offering the right combination of quality, safety, growth, and value for their specific needs and risk profile.
—————————————————————————————- Dividend Kings helps you determine the best safe dividend stocks to buy via our Automated Investment Decision Tool, Research Terminal, Phoenix Watchlist, Company Screener, and Daily Blue-Chip Deal Videos.
Membership also includes
- Access to our five model portfolios
- Daily Phoenix Portfolio Buys
- 50 exclusive articles per month
- Our weekly podcast
- 20% discount to F.A.S.T Graphs
- 50% discount to iREIT (our REIT focused sister service)
- real-time chatroom support
- exclusive daily updates to all my retirement portfolio trades
- Our “Learn How To Invest Better” Library
Click here for a two-week free trial so we can help you achieve better long-term total returns and your financial dreams.
Disclosure: I/we have no positions in any stocks mentioned, and no plans to initiate any positions within the next 72 hours. I wrote this article myself, and it expresses my own opinions. I am not receiving compensation for it (other than from Seeking Alpha). I have no business relationship with any company whose stock is mentioned in this article.

